BIND 9.20 Brings Streamlined Core, Some New Features
Today, ISC is proud to release BIND 9.20.0, our newest stable branch.
Read postAs part of an ongoing study into DNS server performance, we wanted to establish a baseline figure for the absolute maximum throughput that can be achieved using standard APIs. To this end we have developed a tiny DNS server that does nothing except echo the received packet back to the client, albeit with the “QR” bit flipped to indicate that the packet is a response and not a query.
The DNS echo server allows the user to specify how many times it should fork into separate processes, and how many threads (if any) to start within each process. It also supports a number of I/O models, including standard “blocking” I/O and non-blocking I/O using explicit poll(2) or select(2) calls, or via libevent. For multi-core systems it also supports locking processes or threads to a specific CPU core.
We have a test rig comprising a server machine with dual Intel Xeon X5355 quad-core processors running at 2.66 GHz and a client machine with dual Intel Xeon X5365 quad-core processors running at 3.0 GHz. The machines are connected via a 10 Gbps switch using Intel 82599ES-based Network Interface Cards. Both machines are running Fedora Server 21 with kernel 3.19.7-200 and the query generator is Nominum’s dnsperf 2.0.0 as packaged by Fedora and using the included sample query file.
The following graph shows the mean, minimum, and maximum throughput obtained for different numbers of server processes running with the blocking I/O model. Each data point is the result of ten 30-second runs of dnsperf using its default command line parameters. A bare minimum tuning was done on the UDP read/write buffers on both client and server by having the sysctl variablesnet.core.rmem and net.core.wmem both set to a maximum and default value of 16 MB each.
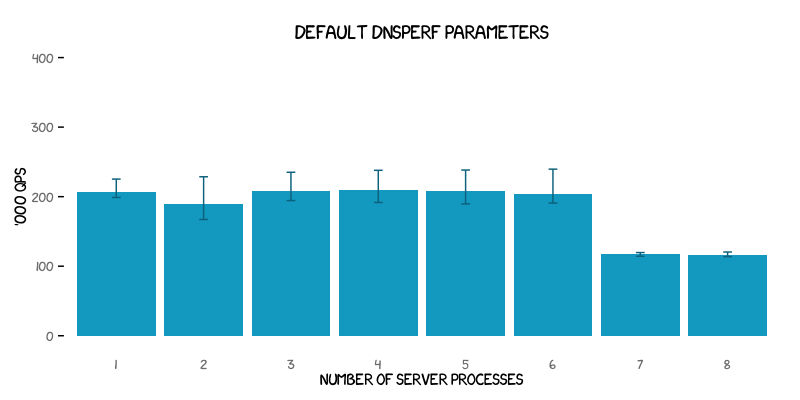
In general the throughput is relatively constant on all three measures, although an explanation for the sudden fall-off when running 7 or 8 server processes in parallel is not immediately obvious. The otherwise flat throughput figure is suggestive that the client itself is limiting the performance. It should also be noted that the variability in the results is quite significant - the results are by no means deterministic.
In order to eliminate client-side effects from the testing a variety of dnsperf settings were tried, eventually settling empirically on apparently optimal settings of -c 8 to make dnsperf act as multiple clients, and -q 500 to allow for 500 maximum outstanding requests. The defaults are -c 1 -q 100. It was also determined that using taskset to restrict dnsperf to using only one of the two client CPUs was more optimal. The reason for the latter remains unclear.
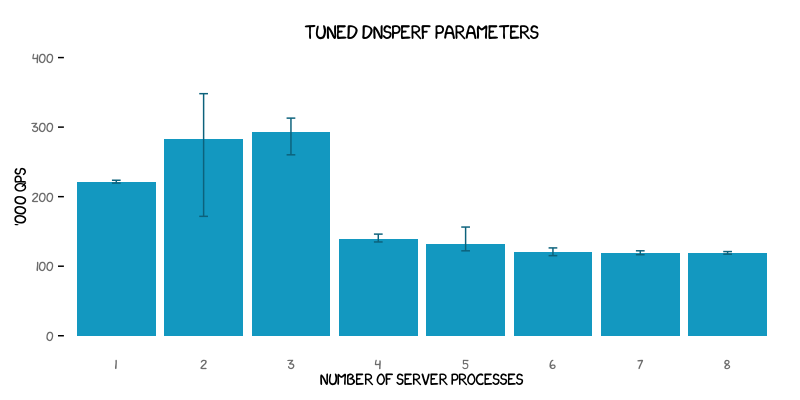
For two or three concurrent server processes both the average and maximum throughput are substantially increased (the latter by 45% to 348 kqps from a previous high of 239 kqps). The variability, however, is even further increased for some tests than before. It should also be noted that the increase in the maximum throughput further reinforces the theory that the untuned dnsperf parameters used to generate the first graph were themselves limiting the maximum throughput of the system as a whole.
To explain the increased variable requires looking further into the network card architecture. The 82599ES NICs automatically configure themselves with eight separate TxRx queues, each with its own interrupt (or “IRQ”) number. Under Linux the association of each TxRx queue with CPU cores is automatically handled by the irqbalance service, and by default it assigns each TxRx queue in sequence to one CPU core.
The number of IRQs that have been handled for each combination of TxRx queue and CPU core can be examined in /proc/interrupts. As each 30-second run of dnsperf starts the counters start incrementing, but at most only 3 individual queues were observed getting involved in handling the network traffic, and therefore only 3 CPU cores.
During each dnsperf run the queue assignments vary, as do the CPU cores allocated to the DNS echo server itself. As a result, just occasionally a highly optimal (or highly suboptimal) combination of queues and cores arises. The lower performance when 4+ server processes are in use requires further investigation, as does the apparent limit of only 3 queues being used. The 82599ES cards do permit finer-grained “per flow” balancing of incoming traffic across the TxRx queues and that may be looked at in a later study.
To further eliminate test variability the irqbalance service was disabled and every TxRx queue was locked to CPU core 7 by executing the following command for each IRQ number associated with each TxRx queue:
# echo 80 > /proc/sys/27/smp_affinity
…
# echo 80 > /proc/sys/34/smp_affinity
The graph below shows the result of allowing the kernel to move the DNS echo server processes randomly between CPU cores, but with only core number 7 handling the network traffic:
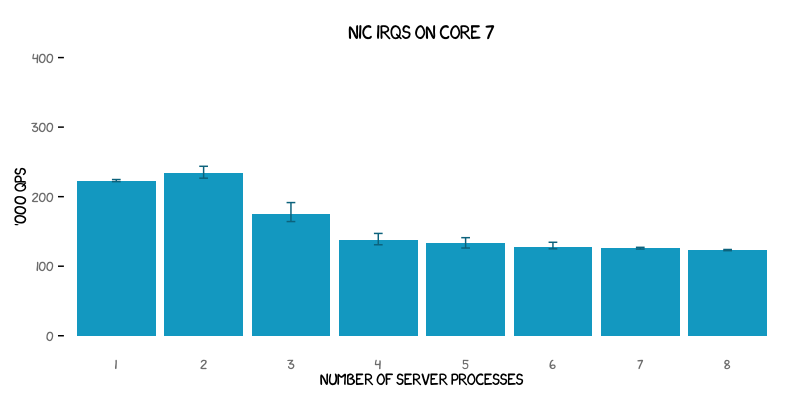
The results now show significantly less variation than before, although the maximum throughput recorded has dropped back to levels below those seen in the second graph.
There is, however, still an observable peak when only two server processes are used. The conclusion must be that in general some combination of two cores is better than any other combination of cores in use.
Let’s therefore examine what happens if we explicitly use just one server process and also explicitly lock that to each CPU core in turn:
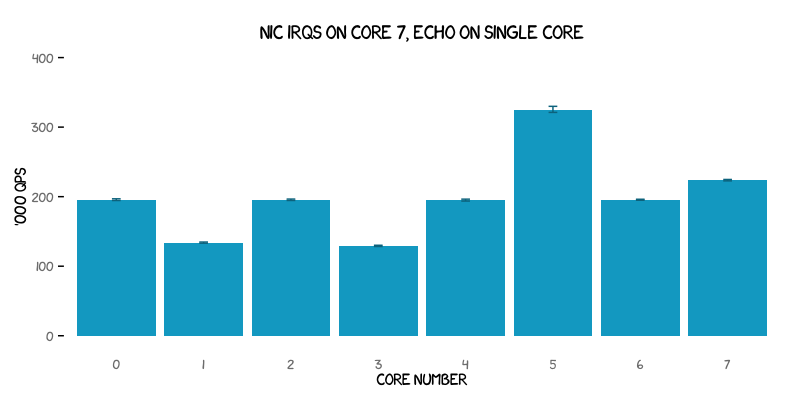
Now things are starting to look really interesting! We see equal results (more or less) for cores 0, 2, 4 and 6; lower but equal results for cores 1 and 3; a very high result (albeit not the highest yet seen) for core 5; and then coming in second is core 7 itself (the one also handling the NIC interrupts).
With core 7 being the last core on the second CPU, and cores 0, 2, 4 and 6 all being on the other CPU, it’s unsurprising that no difference is observed on those cores.
What is perhaps more surprising is that cores 1, 3 and 5 don’t give equal results. The answer lies in the specific CPU architecture in use. Although the X5355 is described as a quad-core processor, it is actually two dual-core dies in one package. Each pair of cores shares a 4 MB Level-2 cache and there’s no shared cache between the two pairs of cores, as shown in this diagram produced by the lstopo program:

With all network traffic being handled by core 7 (PU P#7 in the diagram above) the most optimal (single core) performance is found by forcing the “closest” CPU core to handle the DNS echo server. Letting core 7 do all the work is less efficient.
The lower overall performance of cores 1 and 3 is slightly puzzling. Our current theory is that there is more contention for bandwidth on the memory bus when the two separate dual-core dies both need to access the system-wide shared memory than when cores from different packages need to.
Going back to the earlier observation that some combination of two cores is optimal, further tests were run to find out exactly which particular combination that is, as shown below:
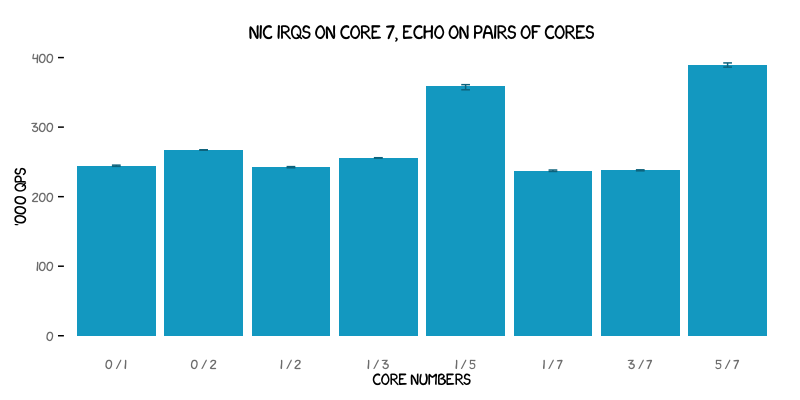
The best combination is when the DNS echo server is run both on the same core as the one handling the network traffic and on the other core from the same die that shares the same L2 cache. This particular combination reached over 390 kqps - some 45 - 65% higher than the results found for most other combinations.
The core 1 and 5 combination is believed to be so much better than combining cores 1 and 3 simply because core 5 already has access to the packet data store in its shared cache with core 7. For those wondering about the combination of cores 3 and 5, its results were the same as for cores 1 and 5, as expected based on the CPU architecture.
For completeness, tests were run on various combinations of three or four cores. The combinations of core 1 or 3 running alongside cores 5 and 7 was about the same speed as cores 5 and 7 by themselves. The combination of four processes running cores 1, 3, 5 and 7 was significantly slower, as were various other ad-hoc combinations of four or more processes split between the two CPUs.
Performance testing is a black art. It is highly dependent on many variables, including CPU architecture, network card facilities, interrupt behaviour, and CPU core affinity.
To produce reliable results requires a significant level of understanding of the systems hosting the tests, the benchmarking software that is exercising those systems and the software under test itself. It is especially important to ensure that you are not simply measuring the limitations of the benchmarking system, as seen in the first graph.
If your DNS server software provides tuning parameters (especially relating to how many processes or threads it will use), it is vital that you benchmark against your own expected traffic patterns and various combinations of those parameters until you find the values that work best for you on your own systems.
We plan to incorporate the lessons learnt above in our internal BIND performance regression test suite, giving us greater confidence in our own test results.
What's New from ISC

Today, ISC is proud to release BIND 9.20.0, our newest stable branch.
Read post